Treemap Chart
Dashboard Designer offers users the ability to create Treemap-type charts. This type of chart allows users to explore and understand the hierarchical structure of their data, easily identifying patterns and trends at different levels of detail. The hierarchy is presented by subdividing rectangles into smaller units. Larger rectangles typically represent the main categories and are divided into smaller rectangles representing subcategories. Users can effectively visualize the distribution of values and compare multiple dimensions clearly and efficiently.
Steps to Create a Treemap Chart:
- Open Dashboard Designer.
- Create a new report or open an existing one.
- Click on the "Treemap" icon.
- Drag and drop the columns from the main view to the section of DATA ITEMS.
- Apply the desired format to the date column.
Dashboard Designer also provides various options to customize the 'Treemap Chart' based on the data type displayed in each column. Below is a general overview of the different options you can apply to your Treemap Chart.
Column of type String:
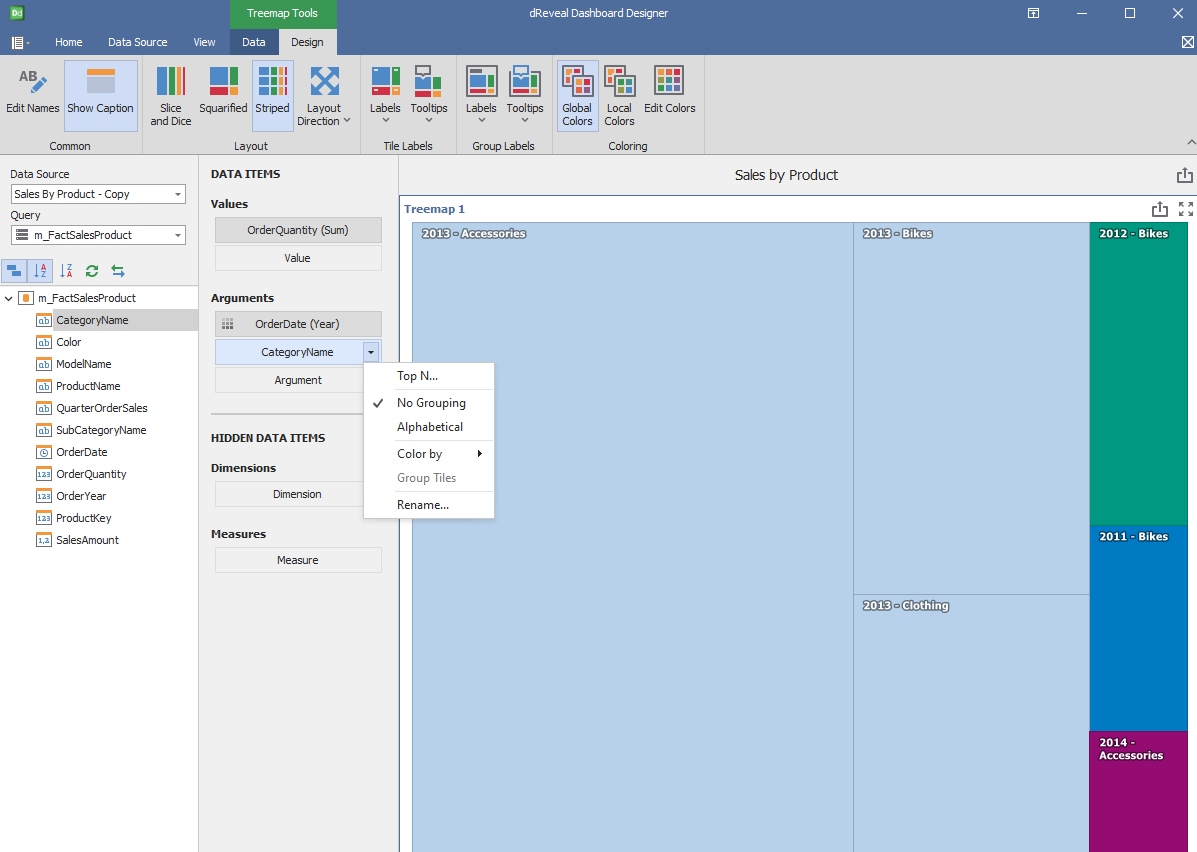
Column of type Date:
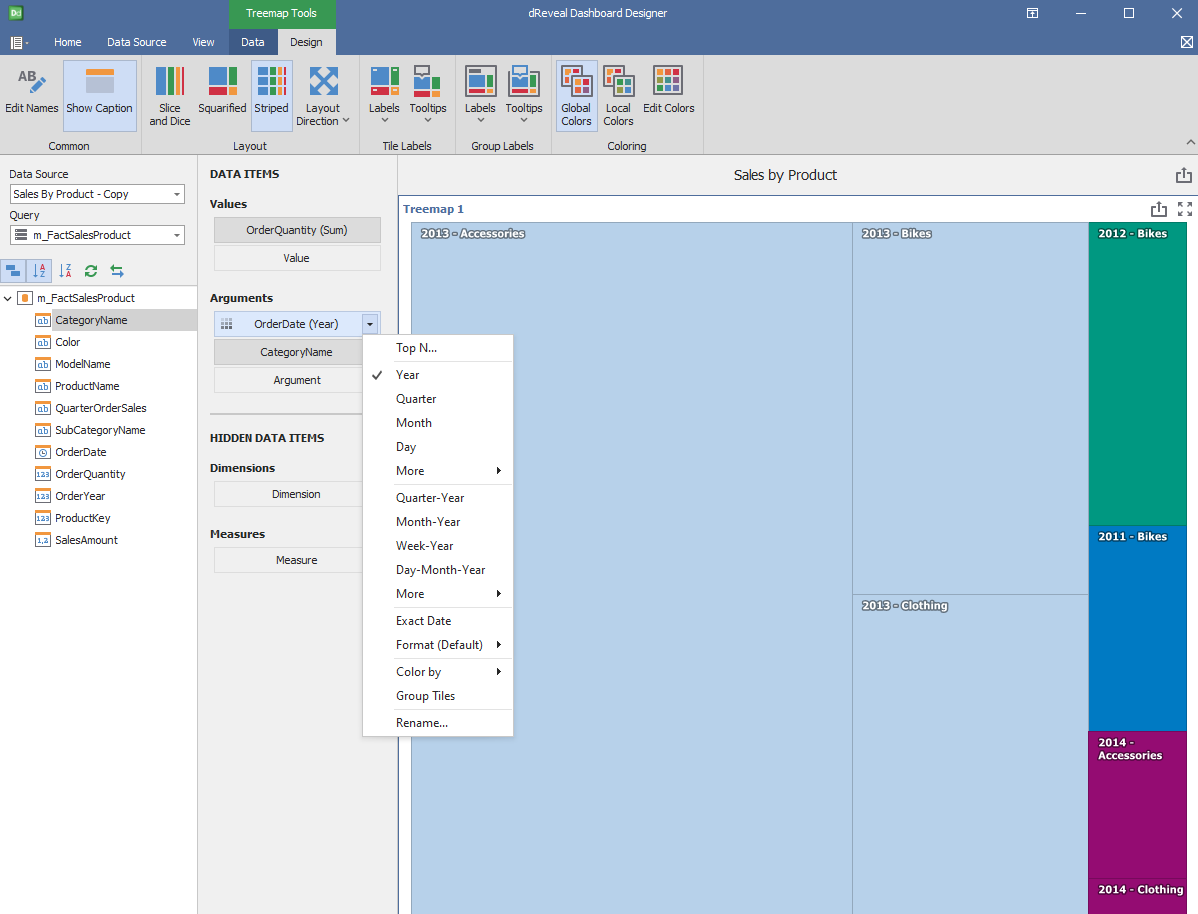
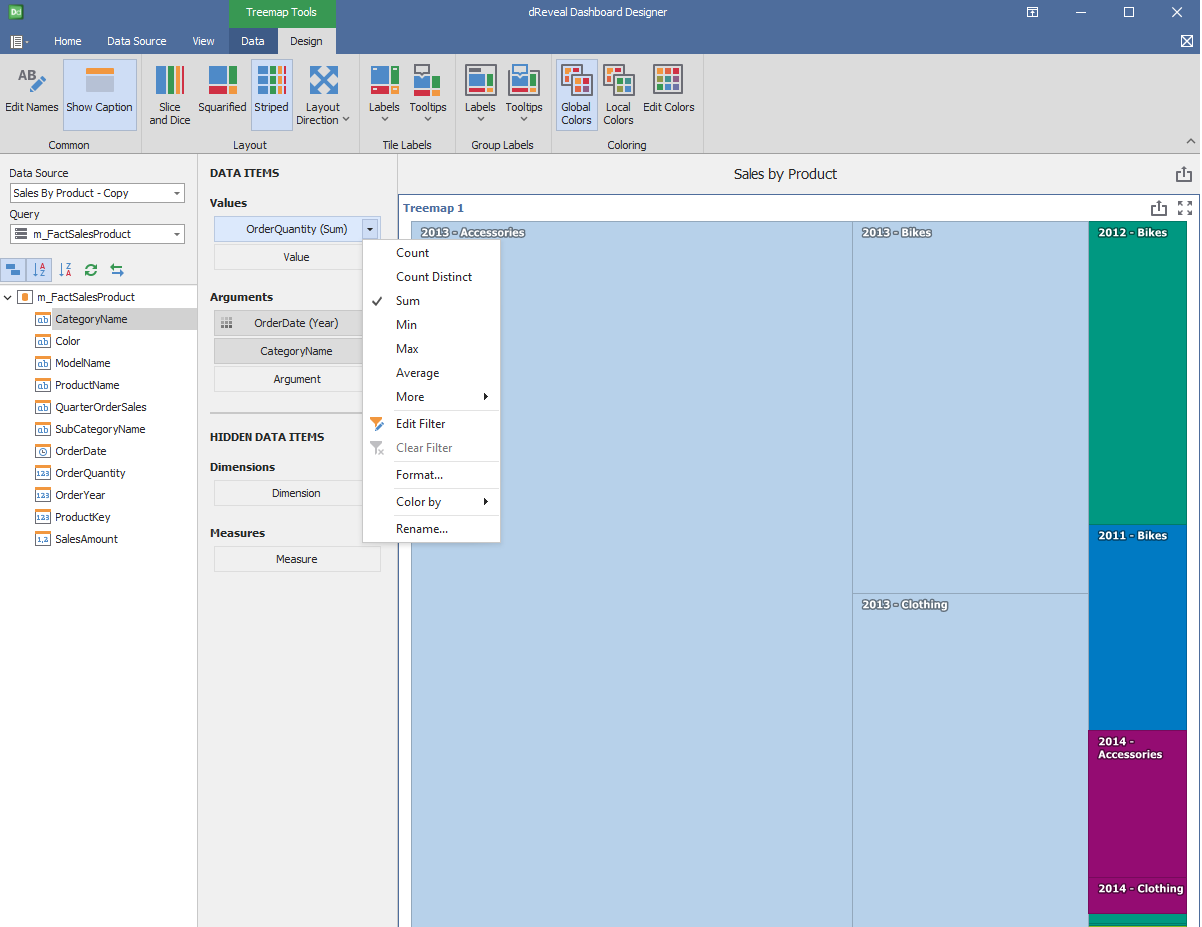
Column of type Numeric:
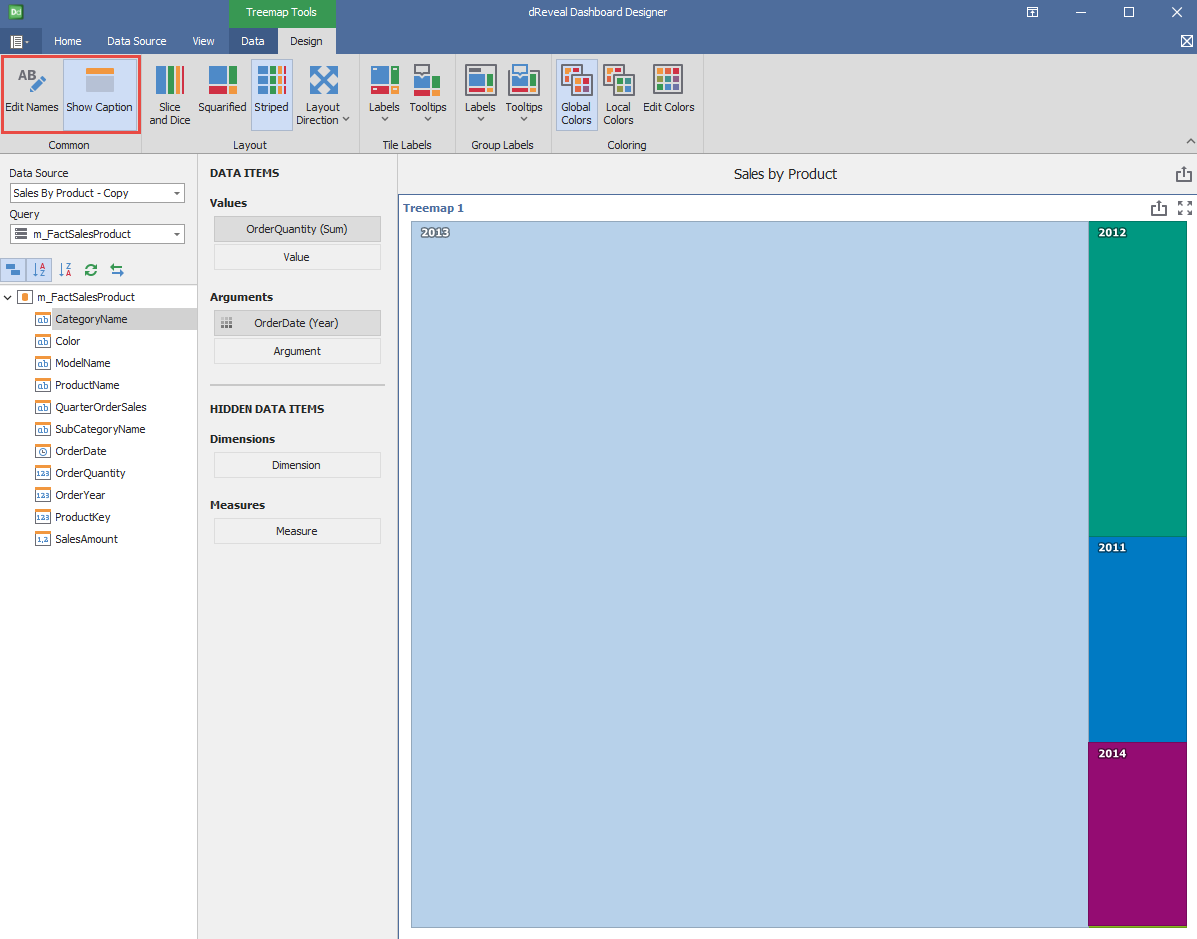
Design
'Treemap Chart' has a variety of options in the 'Design' tab to customize your chart. Next, we will show you the different options you can apply to your Treemap chart.
Common
| Options | Description |
|---|---|
| Edit Names | Edit the name of the chart. |
| Show Caption | Show the dashboard item's caption. |
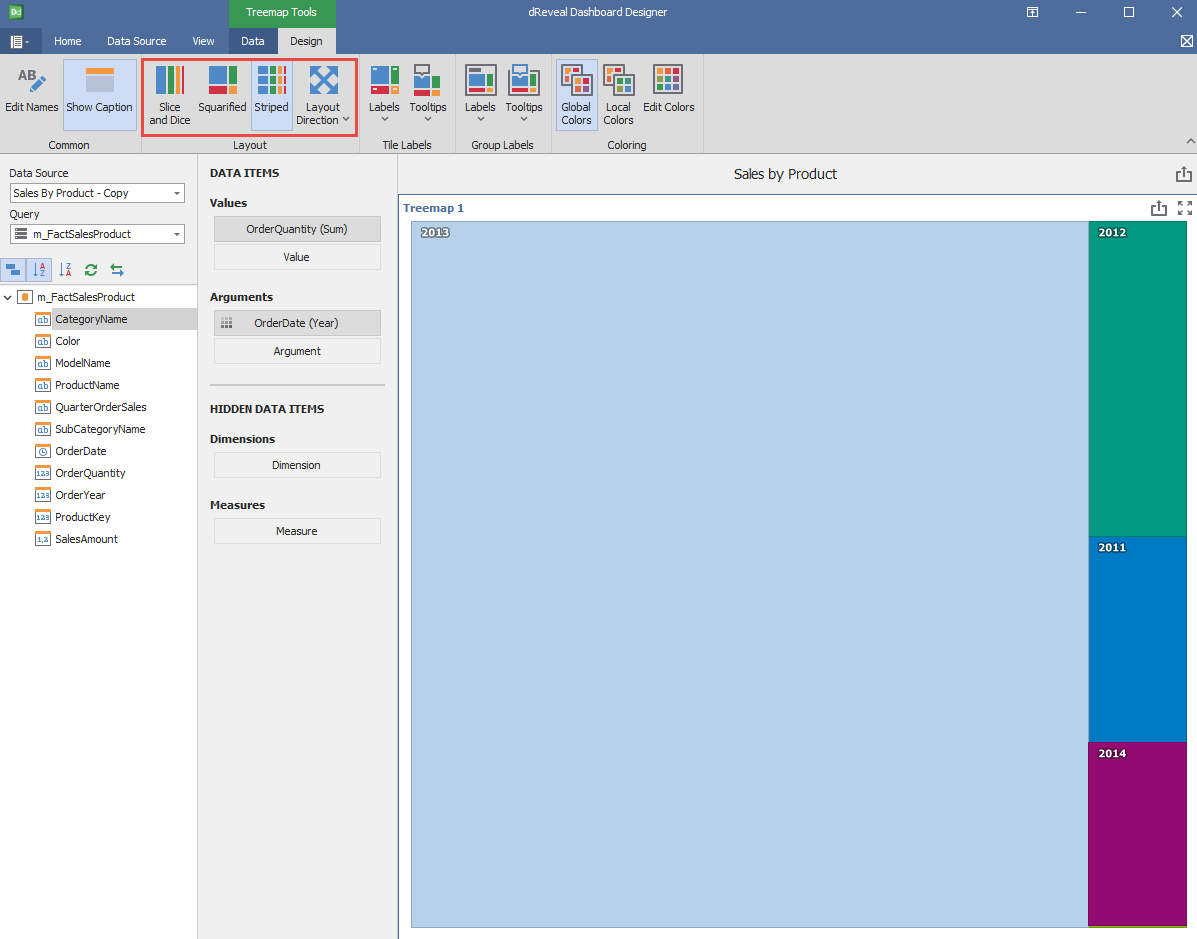
Layout
| Options | Description |
|---|---|
| Slice and Dice | Enable the Slice and Dice layout algorithm. |
| Squarified | Enable the Squarifed layout algorithm. |
| Striped | Enable the Strip layout algorithm. |
| Layout Direction | Specify a layout direction used by Treemap. There are four options: Bottom Left - Top Right, Bottom Right - Top Left, Top Left - Bottom Right and Top Right - Bottom Left. |
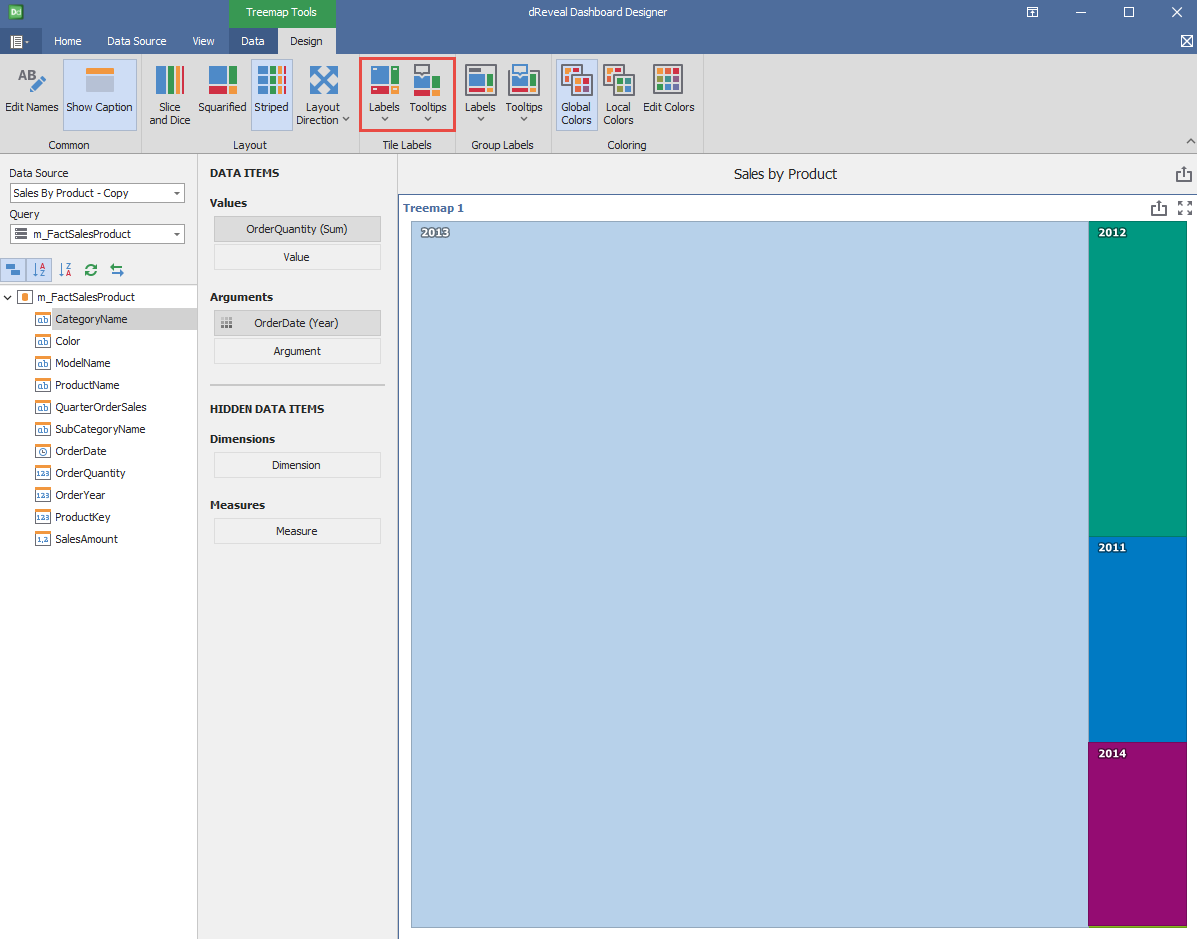
Tile Labels
| Options | Description |
|---|---|
| Labels | Specify which values should be displayed within tiles. There are four options: None, Argument, Value and Argument and Value. |
| Tooltips | Specify which values should be displayed within tile tooltips. There are four options: None, Argument, Value and Argument and Value. |
Group Labels
| Options | Description |
|---|---|
| Labels | Specify which values should be displayed group caption. There are four options: None, Argument, Value and Argument and Value. |
| Tooltips | Specify which values should be displayed within group tooltips. There are four options: None, Argument, Value and Argument and Value. |

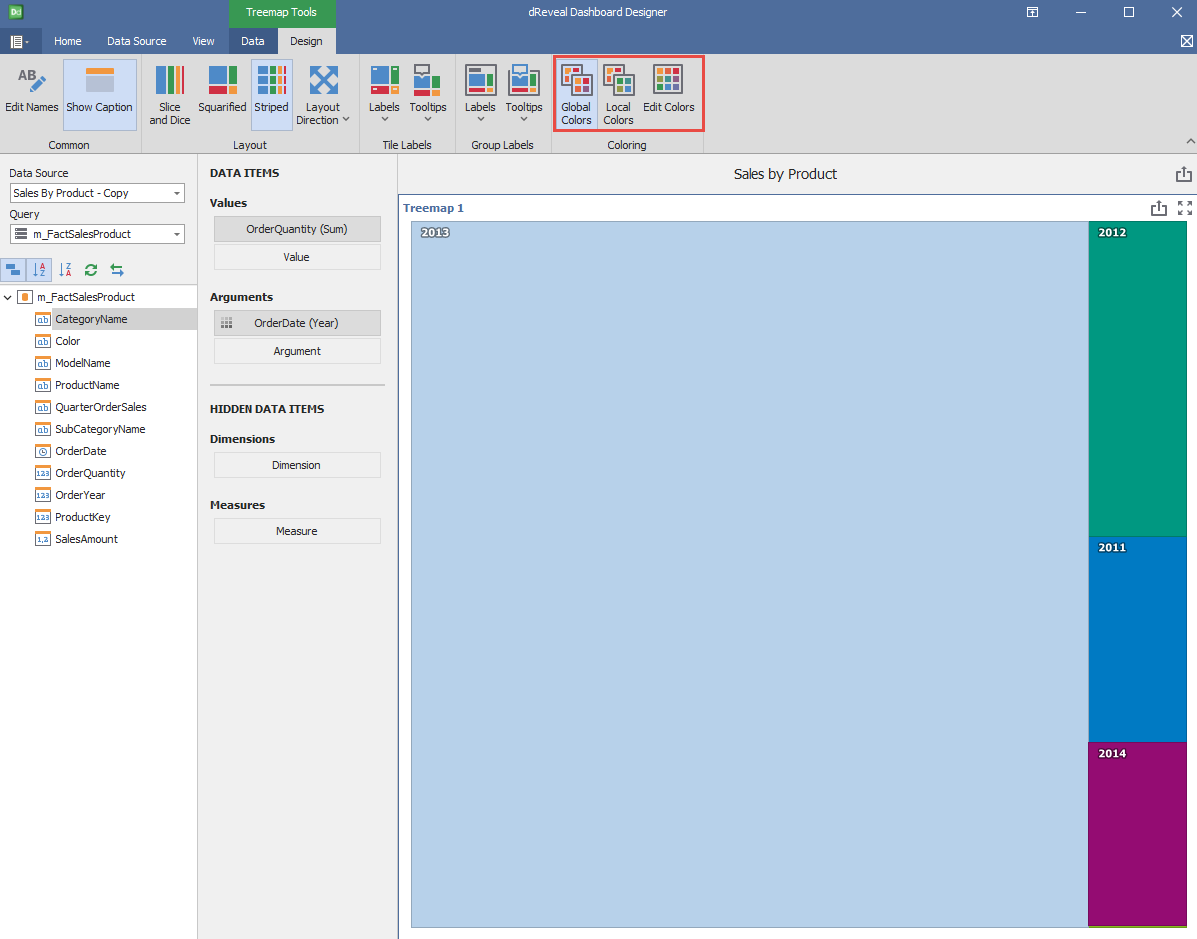
Coloring
| Options | Description |
|---|---|
| Global Colors | Use a global scheme to color elements of a dashboard item. |
| Local Colors | Use a local scheme to color elements of a dashboard item. |
| Edit Colors | Specify colors used to color elements of a dashboard item. |